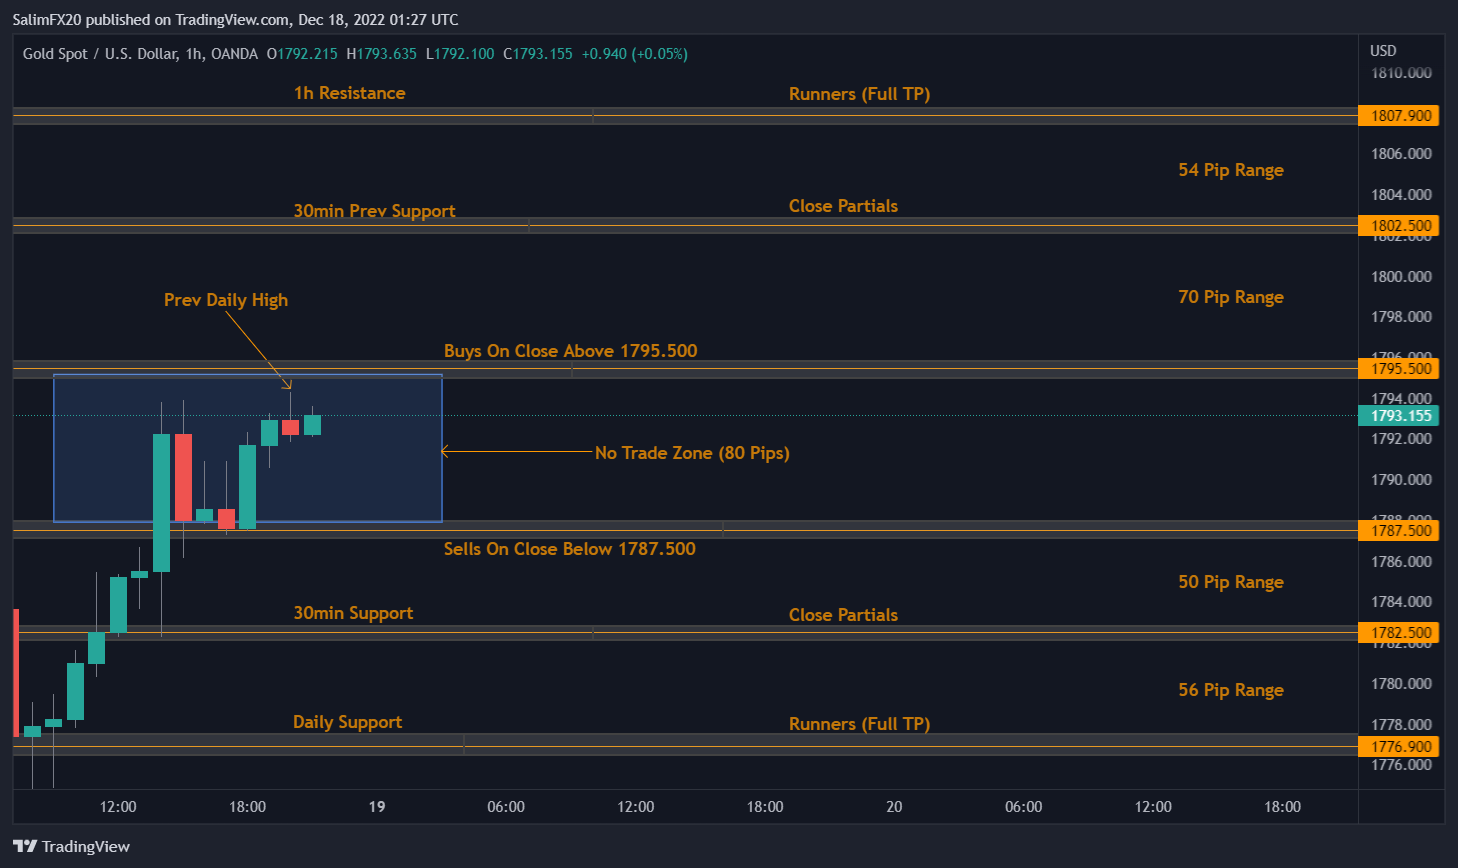
– Buys on close above 1795.500 targeting 30min previous Support at 1802.500, Leaving Runners to the 1h Resistance at 1807.900.
– Sells on close below 1787.500 targeting 30min Support at 1782.500, Leaving Runners to the Daily Support formed on Friday 16th December at 1776.900.
– Overall the current Monthly candle has been retracing after tapping 1820’s, Current Monthly candle hasn’t formed bottom wick so possibly price could be retracing to retest the Weekly Support formed on 21st November 2022 at 1750’s.